
📊 Understanding Your Substack Data: A Quick Guide
How to track what matters and make informed, creative decisions

One of the benefits of a paid membership to The Publishing Spectrum is our Quarterly Data Check-Ins where we talk through your audience insights to help you navigate your next publishing decisions.
To make the most of this benefit, here’s a quick overview of the key places in your Substack dashboard where we check in on your data each quarter.
📍 Where to Find Your Data
1️⃣ Main Dashboard: Your Publication at a Glance
📌 Where to find it: Click Dashboard in your Substack menu.
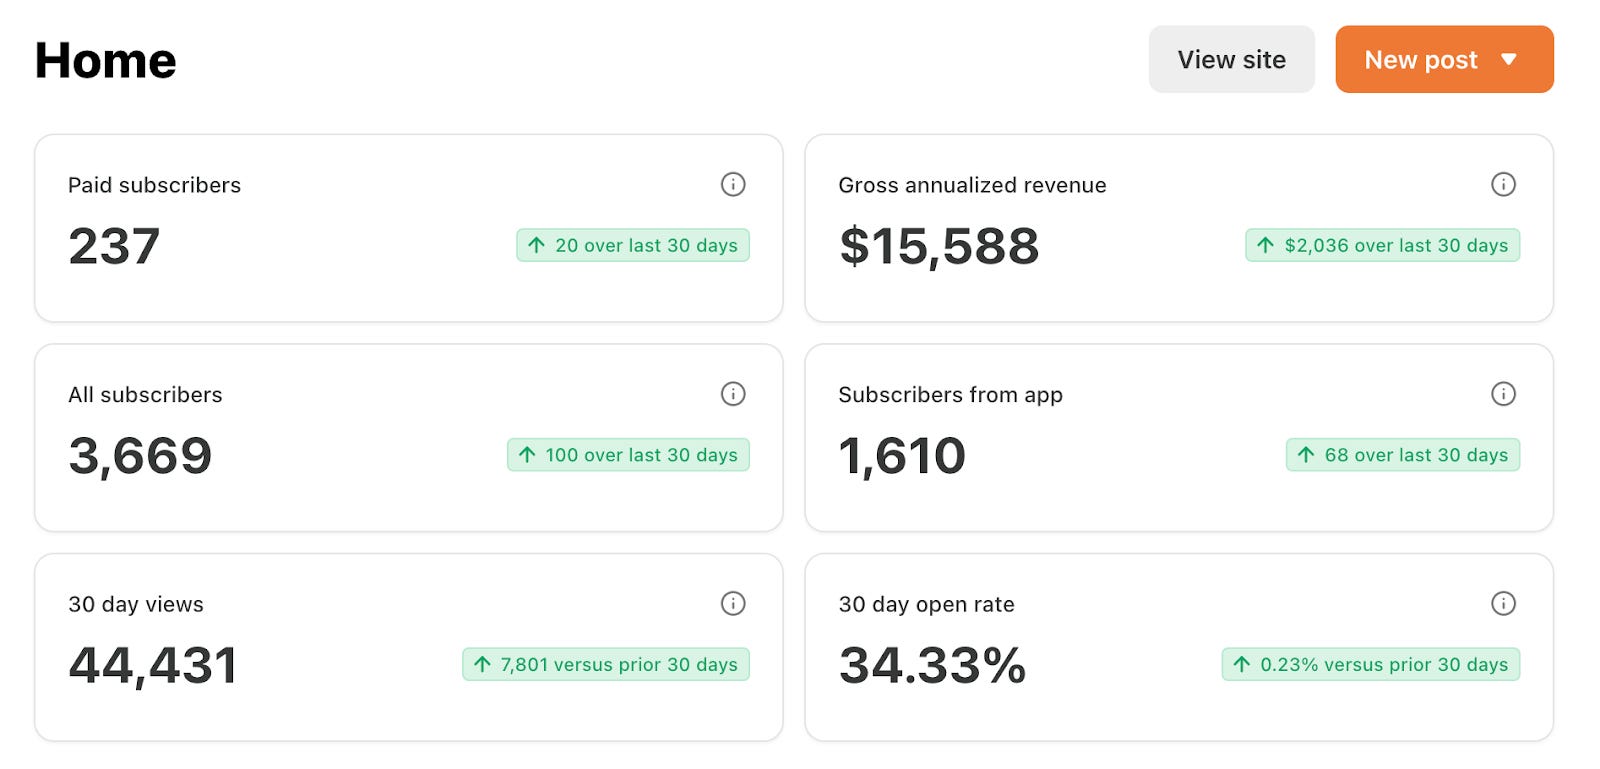
This is your big-picture snapshot, showing:
✔ Total subscribers (free & paid) → How your audience is growing.
✔ 30-day open rate → A key measure of engagement.
✔ 30-day views → A sign of how much your posts are being read & revisited.
✔ Gross annualized revenue → Your estimated earnings based on current paid subscribers; not a reliable measurement of actual revenue in your pocket.
💡 How to use it:
Check your growth trends — is your audience expanding steadily or plateauing?
If open rates dip, this is only a reflection on the strength of your headlines; the overall strength of your editorial plan is seen elsewhere in the data.
Are views growing even if subscribers aren’t? That might mean your archives or promotional efforts are working for you!