

If your open rates are strong but upgrades aren’t, this is usually why
+ 3 places in your Substack data that point to what's really happening

“I’ve got a 45% open rate… so why aren’t more people upgrading?”
It’s a fair question that I see fairly often, but it’s pointing at the wrong data.
Because between “opened an email” and “became a paid subscriber” is an entire journey — and most of it is invisible if you’re only looking at open rates.
That invisible layer is where the real insights live.
In most newsletters I’ve looked at, a large portion of subscribers aren’t actually active anymore — they’re still on the list, but they’re not really engaging in a meaningful way.
Which means you might be making decisions based on an audience that isn’t really there.
***
I’ve spent the last 18+ months inside subscriber data across Substack publications — from a few hundred readers to 190,000+.
And I keep seeing the same pattern:
Creators are making strategic decisions based on a metric that was never designed to answer their actual question.
Open rates tell you if your email got opened.
They do not tell you:
who is building trust
who is drifting away or
who is quietly getting ready to pay.
So when growth stalls, everything usually starts to look like a writing or creative problem.
“Maybe my writing has fallen flat.”
“Maybe my subject lines need work.”
“Maybe I should post more.”
But you can rewrite forever and never fix the real issue — because the insights that you really need aren’t found in your open rate alone.
They’re somewhere else entirely.
***
Across the datasets I’ve analyzed, three patterns consistently change how you understand upgrades:
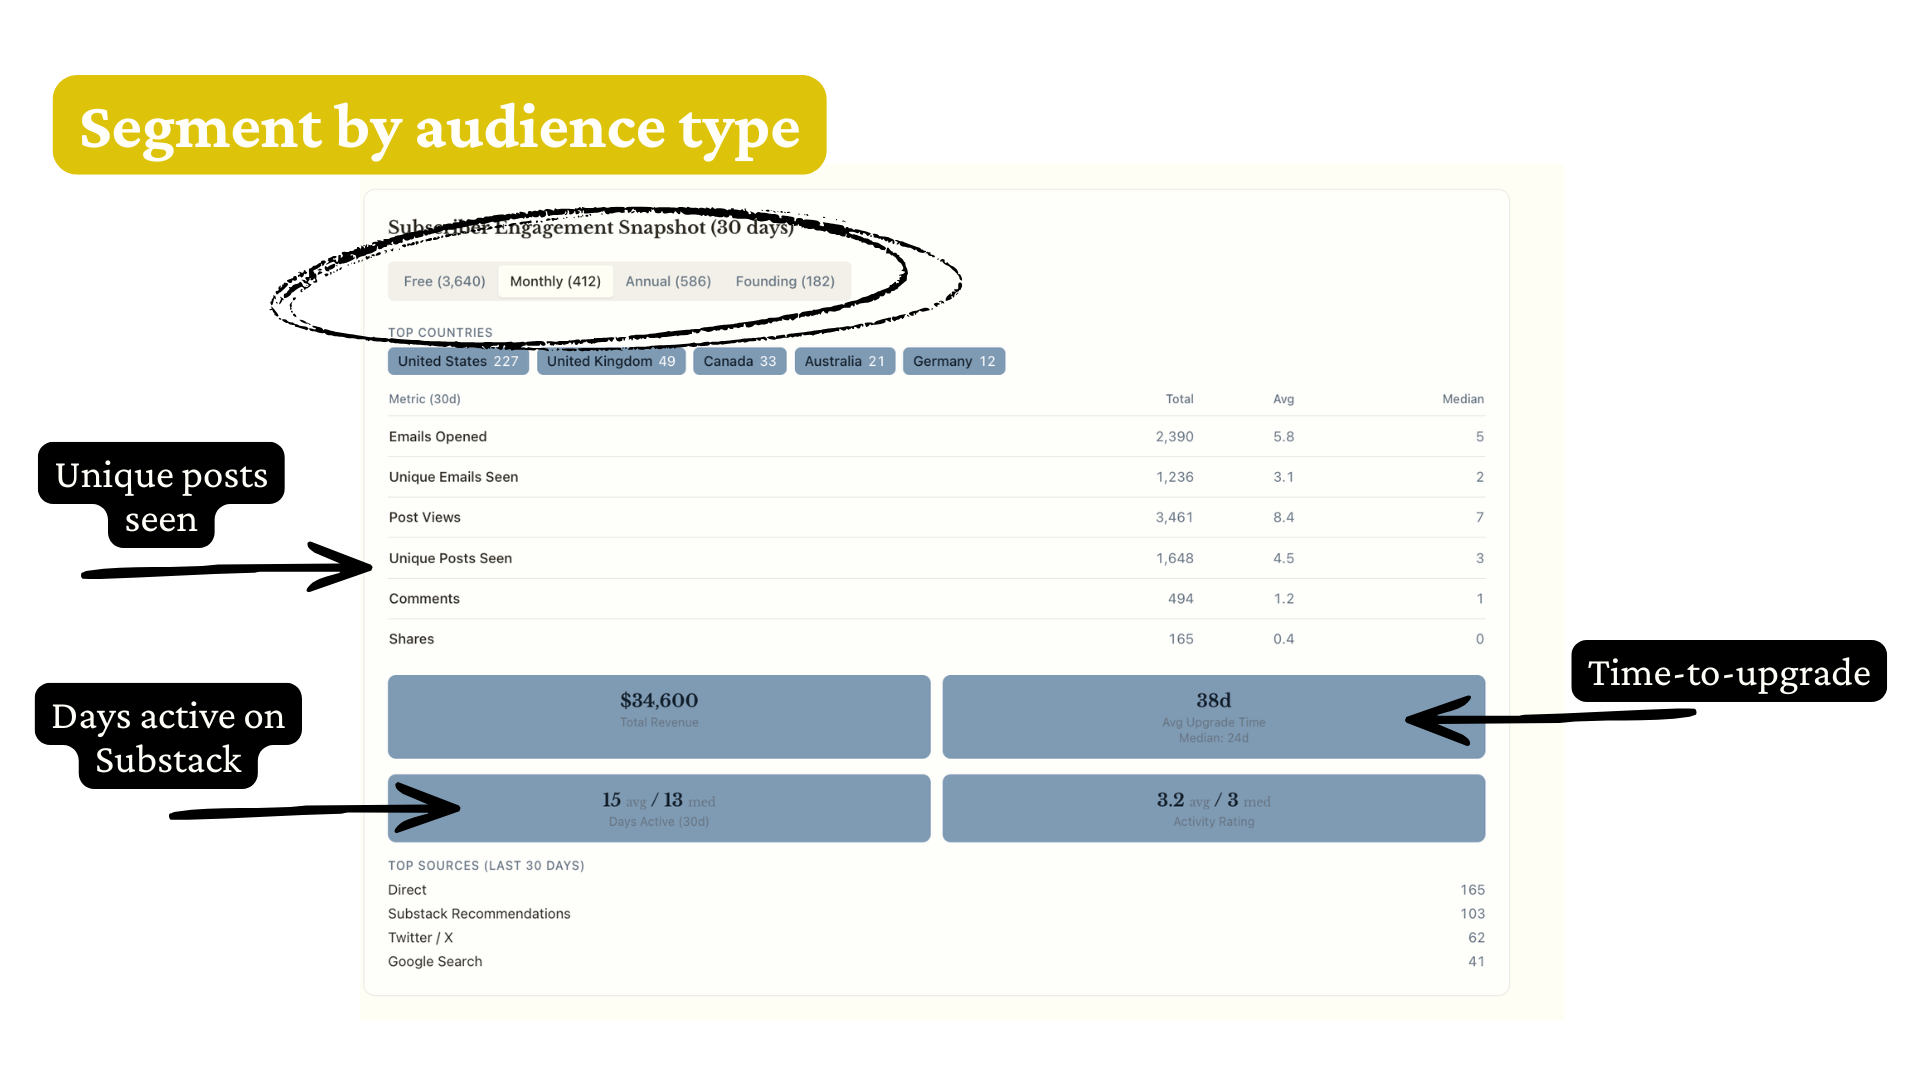
1. Time-to-upgrade
Some readers upgrade in 24 days. Others take 400+. In many cases, most conversions come from a relatively small window of engaged readers — but that window isn’t visible in the default dashboard.
Depending on how your audience is behaving, they require completely different strategies.
2. Activity in the last 30 days
Open rates treat everyone the same. But someone who engaged eight times this month in your Substack publication is very different from someone who opened once in their inbox and disappeared.
This metric tells you which reader segment is actually choosing to be present inside your work.
3. Unique posts seen
Not just email opens — reading/engagement behavior. How many posts are people choosing to spend time with?
This is one of the clearest signals of trust building inside your work as a whole.
***
When you combine these with how you understand your Substack publication, something shifts.
You stop guessing and you start seeing which folks are:
warming up
stalling out or
ready to upgrade (but haven’t been asked the right way yet)
That’s the layer of data most creators are missing.
—
And that’s why I created SubSight.
You upload your subscriber CSV, and it maps these patterns across your audience — so you can actually see what’s happening between an open and the upgrade.
And when you find a gap, SubSight’s built-in assistant helps you explore what you might do next … and suggests a strategy not just based on my frameworks, but based on your work’s editorial insights and how your subscribers actually behave.
“Wow…It’s been super helpful in pinpointing where I can focus my efforts this coming month…”
“I was able to develop a pre-publish checklist (which the tool adorably renamed my “Relational Checklist”) that I can run against all future drafts to ensure I don’t slip into ‘explainer’ mode or get too conceptual.”
If your open rates look healthy but upgrades don’t, there’s usually a gap somewhere in your audience.
If you have a paid subscription to The Publishing Spectrum, you can upload your subscriber export into SubSight and see how your audience is actually behaving — including which readers are active, drifting or closer to upgrading than they appear.
What a SubSight dashboard looks like
I must be really dense but I don't understand what SubSight is. I clicked on the link and still didn't get it. Is it a subscription? An app? A spreadsheet? There's no sign up and I have a "subscribed" button, but I don't know where to go for this. Can you help me out? LoL. 🤣😂🤣
I just downloaded the CSV. There's clearly a wealth of information here, and I have started clicking through the analyses provided. So far, I'm seeing pretty much what I'd expect to see (eg., founding members drive more gift subscriptions). Will future posts break down this tool so that we can absorb and interpret the data section by section? I am in awe but also overwhelmed.