


This is the replay of our live dashboard walkthrough — and everything below will help you set up your Substack dashboard to read it like a publisher would, whether this is your first time in there or your fiftieth.
The full video walkthrough is free to watch — it's a good look at how I approach this work as an advisor. The written primer below covers everything in it, and the exact filter lists are for my paid subscribers.
Before we start, three things worth having open in another tab:
New (free) post this week: Set Up Your Substack MCP Like a Publishing Advisor. If you have access to Substack’s new MCP (it’s available to bestseller publications for now, read the announcement here), this post gives you a prompt to start training your AI agent to think about your data the way a publisher would.
Register: Turning Subscriber Data Into Substack Publishing Decisions. Later this month we’ll take the filters below and turn them into actual decisions — how to nurture your subscribers, wake up the quiet ones and plan your next editorial move from what the data is telling you.
NEW! The Dashboard Read. Thirty minutes with me inside your dashboard — you ask, we look together. $99, available only to paid subscribers. Perks page is here to book.
Now, the primer.
How to think about your dashboard (before you touch a single filter)
A publication has two beating hearts: your editorial direction, and your relationship with your subscribers. Everything in your dashboard is trying to tell you something about one of those two hearts. When a number can’t tell you anything about either one, you’re allowed to set it aside for our purposes today. Most of the views in your Substack dashboard fall into that category (I prefer revenue and budget-planning discussions to be rooted in Stripe data), which is why this primer is as much about what to skip as where to look.
Three principles I carry into every dashboard:
Trends over snapshots. One number on one day means almost nothing. The same number tracked across 30 or 90 days starts to tell a story.
The 2–3% rule. A shift of two or three percent is usually just human behavior being human inside a publication. A shift of 15–20% overnight almost always means something technical changed — an inbox filter, a tracking pixel, a platform update. Try not to take tech problems personally.
Your dashboard is not your source of record for money. The revenue number here doesn’t account for coupons, Substack’s 10%, or Stripe’s 3%. When you’re deciding whether you can hire an editor or invest in your publication, go to Stripe. The dashboard shows you the shape of your revenue, not the truth of it.
One more thing before we go in: I keep my home-page stats hidden, and you can too. Those three big numbers — gross annualized revenue, paid subscribers, total subscribers — are a fine high-level glance, but you won’t make a single good editorial decision from them. If you’re in a creative incubator season, they can do more harm than good.
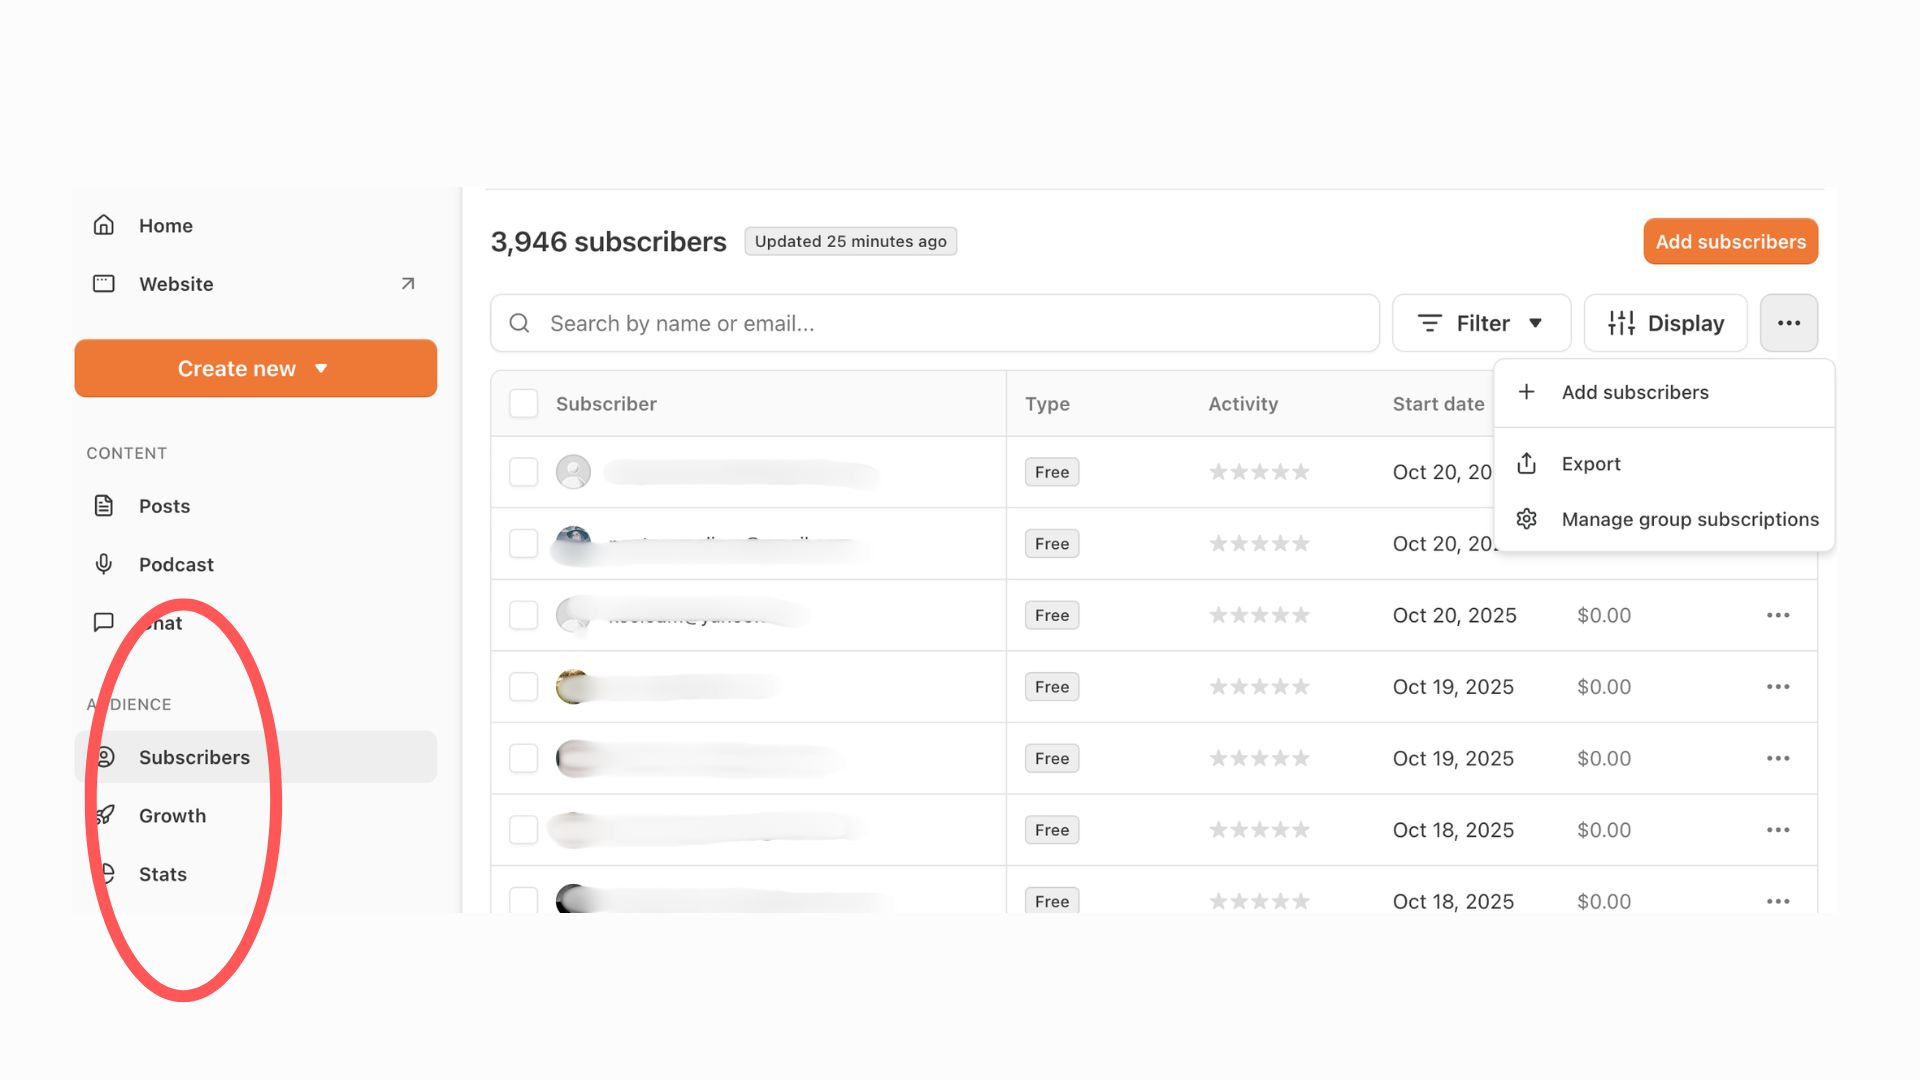
We’re going to visit three places in your dashboard (circled below), and each one answers a different question.
If you're new here: The Publishing Spectrum is a place for writers becoming publishers. Subscribing for free gets you this full tour — what each view in your dashboard can tell you, what to skip and how a publisher reads what's there. The exact filter lists I build, including two displays for tracking paid subscription movement, live behind the paywall as part of the paid practice.


